High speed (balanced) differential signal measurement with single-ended oscilloscope (unbalanced)
INTRODUCTION
In this article we will see how it is more common the eventuality of having to monitor and measure fast signals of type differential (balanced signals), corresponding lines of clock High Speed or Serial Data Bus to high speed, during the repairs, debugging and/or testing of electronic equipment. Sometimes, however, the only instrument available is an oscilloscope with single ended channels and referred to GND (unbalanced), maybe with extended band (in our case we use an R&S RTO1044 (4GHz band, 4GSa/s).

Fig. 1: example of Single-ended and Differentia connectionl
Even selecting the input of the oscilloscope set and terminated at 50 ohms would still have a strong mismatch since one of the differential lines, for example "I" (see Fig. 1), would be connected to GND.
In the following paragraphs, it will be described a simple and useful operating method to overcome the problem of this mismatch, in the multiple situations that can occur during testing, debugging, repairs.
CHAIN OF GENERATION AND DISTRIBUTION DIFFERENTIAL CLOCK 512MHz
In the specific case under analysis, during debugging/repair of an electronic test system, it was necessary to monitor the clock signal @512MHz generated and distributed using the chain shown in Fig. 2. The "test points" in which it was necessary to measure the differential signal is indicated as TP1 – TP8.

Fig. 2: electronic system chain debugged/repaired
The clock signal @512MHz originally generated by U104_1, consists of an LVPECL square wave the oscilloscope value of which involves at least the following harmonics:
- 1st harmonic: 512MHz
- 3rd harmonic: 1536MHz
- 5th harmonic: 2560MHz
The spectrum analyzer was used to verify the correctness of this spectrum analyzer and appropriate RF probe, measuring the CLK and CLK- outputs of the U104_1 device. The detected spectrum is shown in Fig. 3.

Fig. 3: Spectral content of clock signal @5125MHz output from U104_1
From Fig. 3 (from the spectral content of the differential clock signal) It is possible to see how the 7th and 9th harmonics are also appreciable! (3584MHz e 4608MHz)
By now all that remains is to verify with the oscilloscope the propagation and distribution of the clock signal generated along the whole chain of Fig. 2 (test point TP1- TP8).
512MHZ DIFFERENTIAL LINE AND CLOCK MONITORING WITH OSCILLOSCOPE AND AN ADAPTED AND ISOLATED ADAPTER FILTER
In order to avoid mismatching of differential lines at different measuring points TP1 – TP8, for monitoring differential signals with 50R oscilloscope, has been realized an adapted and isolated coupling filter with BAL-UN transformers (RFXF9503 model), a dual-channel adapted, which electrical diagram is shown in Fig. 4. In this case the vref was connected to N2V voltage.

Fig. 4: electrical diagram of the coupling filter with BAL-UN transformers
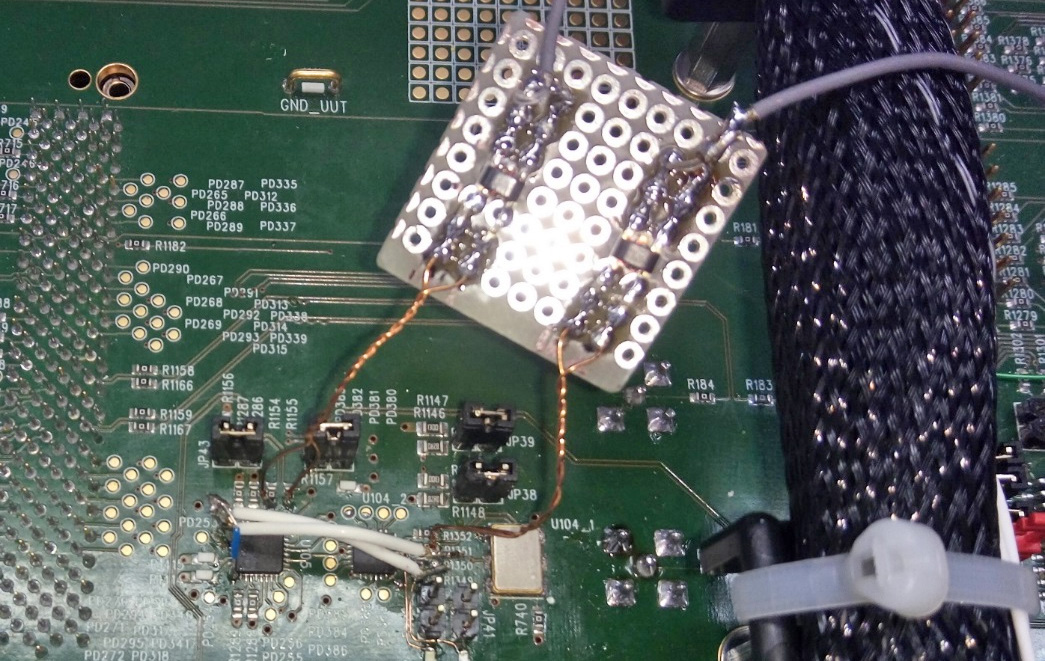
The filter has been made on a matrix plate, with SMD components and short COAX cables to connect SMA connectors output. The realization of the filter is reported in Fig. 5.

Fig. 5: realization of the coupling filter with BAL-UN transformers
The filter was then inserted by soldering the terminals of the two differential inputs in the various TP1 test points – TP8, in easily accessible points on the PCB (see Fig. 6 e 7).

Fig. 6: PCB coupling filter mounting for oscilloscope measurements

Fig. 7: PCB coupling filter mounting for oscilloscope measurements
In the following figures Fig. 8 and Fig. 9 it is possible to appreciate the measures detected with oscilloscope, in particular in Fig. 8 at the U105 output the quality of the signal is lost by picking the signal without insertion of the isolated coupling filter.

Fig. 8: monitor with oscilloscope, U104_1_OUT with adapter filter, U105_OUT without adapter filter

Fig. 9: monitor with oscilloscope, U104_1_OUT e U105_OUT both with adapter filter
CONCLUSION
In the previous paragraphs it was presented a simple and useful method for measuring differential "High Speed" signals during debugging, testing, and repair directly on PCB.
The low-cost implementation of a simple adaptive and insulated coupling filter allowed to monitor a clock signal @512MHz appreciating with wide-band oscilloscope 1a and 3a harmonic (512MHz and 1536MHz) spectral content and especially the correct dynamics of 800mVpp. This does not occur in the case of U105_OUT output which is much more distorted and attenuated by omitting the insertion of the coupling filter (see Fig. 8).
Anyway it is possible to note two further aspects:
- The U105_OUT signal is nota s clean as the generated signal U104_1_OUT (see Fig. 8);
- The 5th harmonica, attenuated by more than 20db compared to the 3° (see Fig. 3), is not noticeable by means of an oscilloscope.
The aspect of point 1 is due to PCB tracks of excessive length and partial loss of signal integrity. This is precisely a defect that could be confirmed using the method of measurement described. The aspect relative to the point 2, however tied to the low dynamics of the 5a harmonic and confirmed by means of spectrum analyzer (see Fig. 3), could be improved by realizing the filter of coupling on PCB with tracks, layer, connections, connectors and cables to the oscilloscope of considerably higher quality, but with higher costs.
Given the low cost, the coupling filter realized, although handcrafted, proved to be a remarkably useful and efficient method in case of debugging, repair, testing, for differential signal measurements "High Speed" using an oscilloscope and also a spectrum analyzer.
Thank you for your attention, if you have any questions or would like to leave a comment we will glad to answer to you.
Cristiano Cenci
Paolo Stocchetti
- Log in to post comments